2025 Release Wave 1: Microsoft Power BI

Jul 16, 2025
  • IT
  • Microsoft

From smarter visuals to real-time write-back, Microsoft Power BI is evolving fast - and if you’ve been keeping an eye on the updates this year, you’ll know there’s a lot to be excited about. In this blog, we highlight the updates that matter most and how they can help you work more efficiently, collaborate more easily, and make better decisions.

👉 Are you looking for the updates about Microsoft Fabric? Make sure to read our next blog, as well.

Microsoft Power BI Desktop

64-bit version

As of June 30, Microsoft Power BI Desktop is no longer available in 32-bit. If you’re still using that version, now’s the time to upgrade to 64-bit to ensure compatibility with new features and better performance.

Improved start-up

You might’ve noticed the refreshed start-up screen when opening Microsoft Power BI Desktop. But the real upgrade is under the hood: performance improvements mean the app now launches faster and runs more smoothly on your local machine.

Translytical task flows (preview): real-time write-back in reports

This new feature introduces a powerful capability: you can now add, edit, or delete data directly in the underlying database — all from within your Microsoft Power BI report.

That means real-time decision-making becomes much easier. You can instantly update your data source and analyze the impact immediately. It’s especially useful for:

  • Budgeting: Adjust figures and see how they affect your financial plan.
  • Forecasting: Update assumptions and track how projections shift.
  • Scenario planning: Test different outcomes and compare results on the fly.

Translytical task flows use Microsoft Fabric’s preview feature, User Data Functions, which provide native connection management for Microsoft Fabric SQL databases, warehouses, and lakehouses. This ensures seamless integration and optimal performance.

⚠️ Note: This feature requires Microsoft Fabric capacity, since Fabric items are being used.

Read more about translytial task flows on Microsoft's website

Visual calculations: more flexibility, more control

Recent updates to visual calculations include:

  • Support for conditional formatting
  • Highlighting of referenced columns
  • New functions like LOOKUP and LOOKUPWITHTOTALS
  • Parameter pickers to help you choose values more easily

Explore the update on Microsoft's website

Field parameters: smarter sorting and broader support

Field parameters are becoming more powerful:

  • Persisted sorting: Sorting now remains on the selected category, even when switching fields.
  • Support for DirectLake models: Making dynamic reporting more flexible.

This feature is generally available as of July 2025.

More information about Field parameters on Microsoft's website

New slicers for better filtering (preview)

  • The Text Slicer is a preview feature designed for scenarios where users need to filter by names, categories, or other large text-based fields. Unlike traditional slicers, it allows filtering based on keywords within a field, rather than requiring an exact match. A recent update makes it even more powerful by supporting multiple keywords, enabling users to filter for several terms at once.
  • The List and Button Slicers, also available as preview features, offer a smoother, more modern take on the classic slicer experience. The List Slicer now includes an improved visual design with support for labels and images, making options easier to recognize. It also supports hierarchical fields, allowing each level of the hierarchy to be visually customized independently,  for clearer and more flexible filtering.

Sparklines: Trends at a Glance

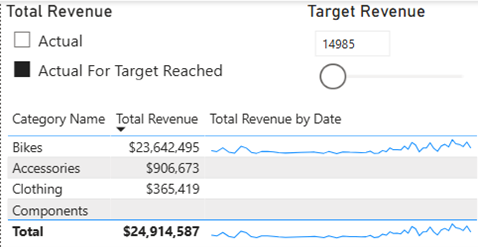
Sparklines are now generally available in Microsoft Power BI. They allow you to show trends over time within tables and matrices. You can use them alongside calculation groups and numeric parameters for more tailored insights.

Example: Display product sales trends across categories, or highlight only those that meet specific targets.

Read more about Sparklines on Microsoft's website

Microsoft OneDrive and Microsoft SharePoint Integration (preview)

New preview features make working with your Power BI files (.pbix files) more seamless:

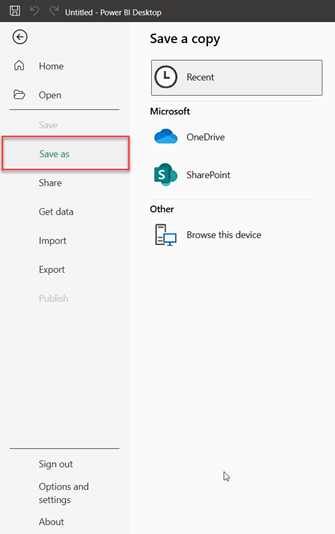
  • Save to OneDrive and SharePoint
  • Share to OneDrive and SharePoint
  • Show the New File Saving and Open Experience 

These features make it easy to navigate, open, save, and share your files directly from and to OneDrive and SharePoint.

Moreover, the preview feature Saving to OneDrive and SharePoint uploads the file in the background and ensures your changes are automatically saved to your OneDrive or SharePoint location, so you always have access to the previous and latest versions.

Microsoft Power BI Online

Microsoft Copilot

Microsoft continues to expand Copilot’s capabilities. Here are some of the most meaningful updates and newest prompts:

  • 'Answer a question about the data': Generates three suggested questions to help you explore your dataset.
  • 'How Copilot arrived at this': Explains which tables and fields were used and how they were aggregated.
  • Explore this visual': Dive deeper into the results generated by Copilot.
  • Improved support for DAX queries and natural language
  • Add Copilot summaries to Microsoft Power BI email subscriptions

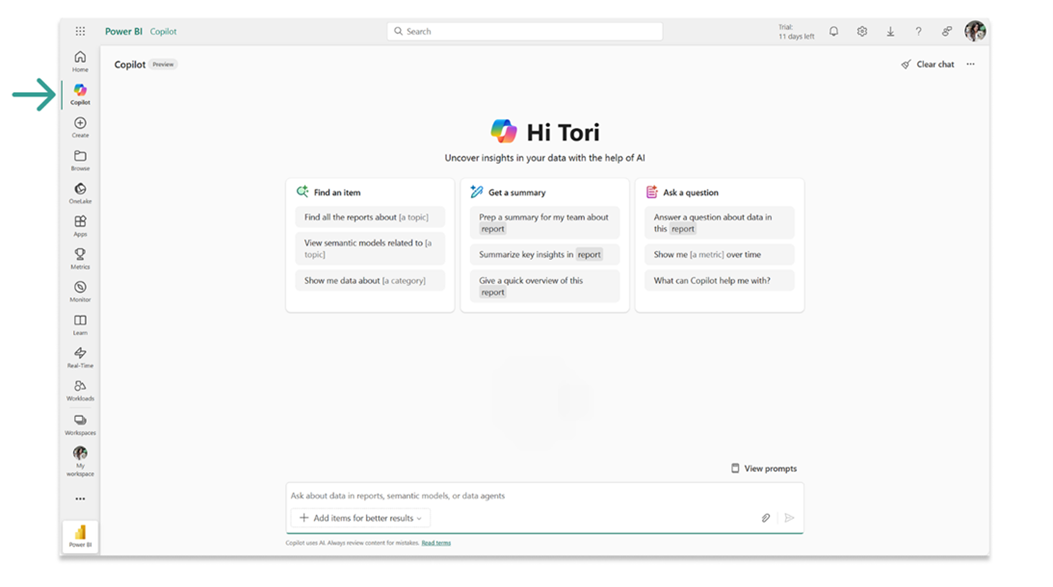
Standalone Copilot


Microsoft also introduced a standalone Copilot option in Microsoft Power BI. This lets you ask questions across all artefacts you have access to - not just the one you’re currently viewing. As of July, verified answers are included in Copilot's responses.

Example: “Which items contain info about margins?” or “How are we doing in terms of sales compared to last year?”

Explore the standalone Copilot on Microsoft's website


Prep your data for AI

Copilot now helps you optimize your semantic model for AI use cases - making it easier to get meaningful insights from your data.

Learn more on Microsoft's website

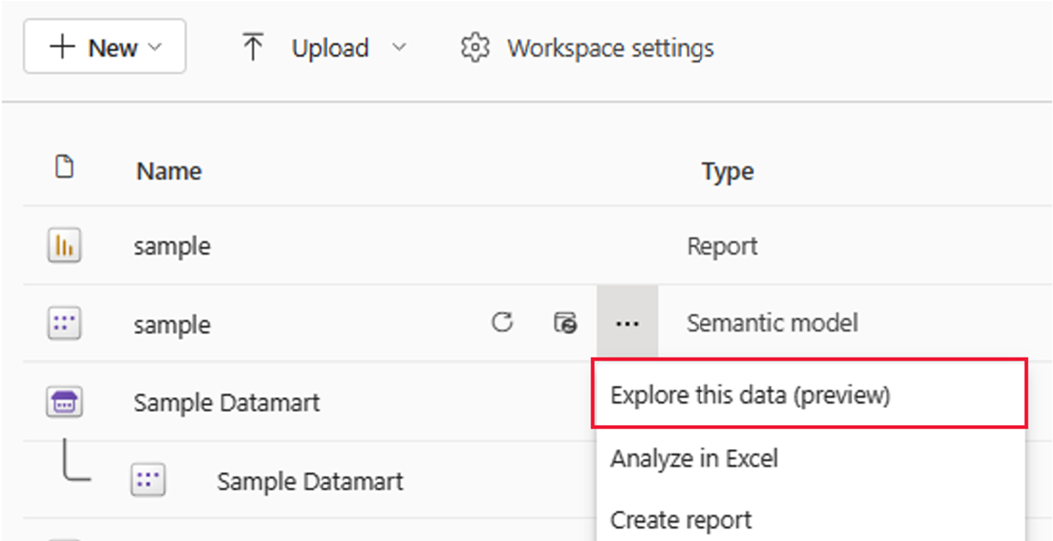
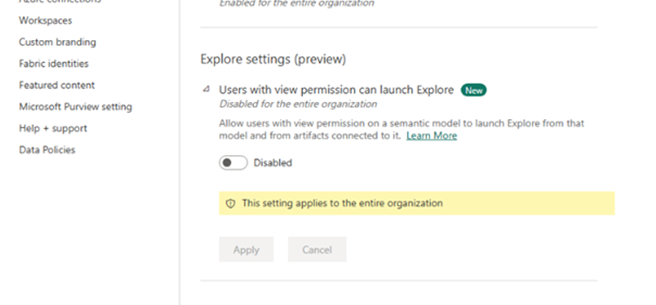
Explore this data (preview): a new way to interact

This feature lets you explore your semantic model without building a full report. You can:

  • Create basic visuals, tables, and matrices
  • Add filters and visual calculations
  • Save and share your exploration

⚠️ Note: This feature is enabled by default for viewers, which may expose sensitive data. Admins can manage access via Admin Portal → Tenant Settings.

Explore the update on Microsoft's website

PowerPoint integration

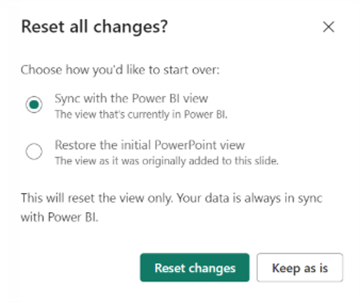
When embedding Microsoft Power BI reports in Microsoft PowerPoint, you can now choose whether to keep the original layout or sync with the latest version online.

Moreover, you can now add text directly to visuals to elaborate on specific topics - useful for storytelling and presentations.

⚠️ Note: This only works with single visual add-ins.

Read more about the PowerPoint integration on Microsoft's website

Semantic model editing with version history (preview)

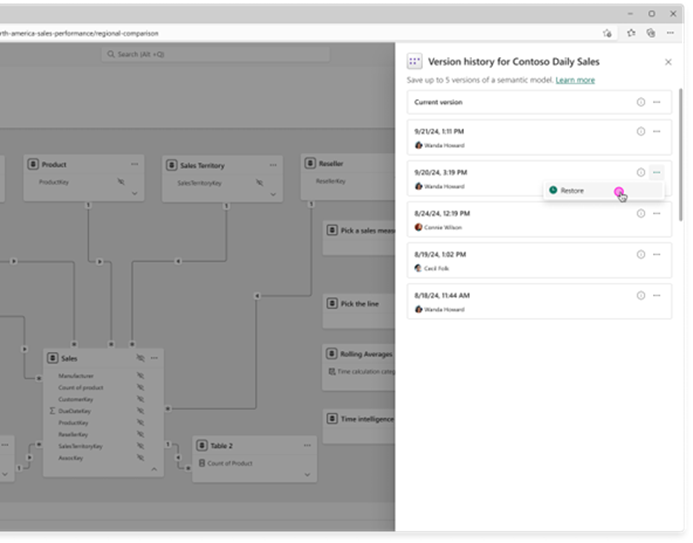
Collaborating on semantic models used to make it difficult to track ongoing changes. While deployment pipelines show differences before moving to test or production, there wasn’t an easy way to monitor edits in real time. That’s now changed in Microsoft Power BI Online - you can see who made which changes and even restore previous versions when needed.

⚠️ Note: This only applies to edits made in Microsoft Power BI Online. Publishing from Microsoft Power BI Desktop will override version history.
⚠️ Note: Enabled by default in Pro workspaces, but can be disabled via the Admin Portal.

More information on Microsoft's website

Wrapping up

In this blog, we’ve highlighted some of the most impactful Microsoft Power BI updates from the first half of the year. For a complete list of all recent changes, we recommend checking out the official Microsoft Power BI update blog.

Microsoft has released a new Fabric roadmap, offering a clear overview of upcoming features and their expected release or general availability dates. It’s a helpful resource for staying informed about what’s coming next in Microsoft Power BI and beyond.

Need help?

Microsoft Power BI continues to grow - not just with new features, but with thoughtful improvements that make working with data more intuitive and collaborative. Whether you’re building reports, exploring insights, or managing models, these updates are designed to help you work smarter.

Want to explore these features in your own environment or need help getting started? We’re happy to guide you.


Related content