
/Website_Landingpage_VisualAnalytics_780x340-(1).webp?mode=autocrop&w=1000&h=750&attachmenthistoryguid=7421dda6-1a69-476f-bc11-5d44ebb81894&v=&focusX=299&focusY=147&c=b53c7c88c5191428ce3c60e4382e6a2f94c0f18850127949a78f78d6728f3d69)
Quick insights into a world of data
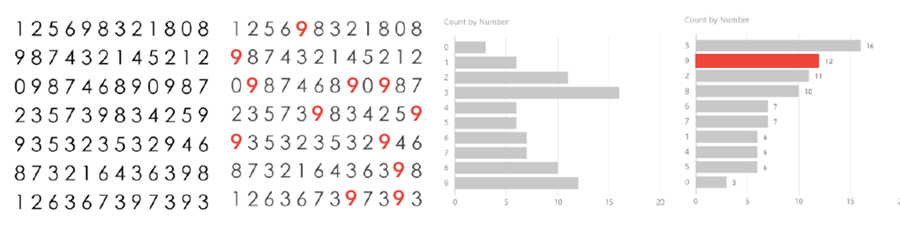
Data is produced at an incredibly fast rate – faster than most people can analyze and report on it. To solve this problem, a host of data visualization solutions haven been developed to help data scientists and other, even non-technical, professionals discern patterns and connect the dots in an ocean of data.
Visual analytics is nothing more than a modern term for reporting. In the past, there were only a few data sources to analyze. Because everything was extremely fixed-format and predefined, gaining these insights was the responsibility of the IT department. As a result, non-technical professionals often had to wait for long periods of time to receive their reports and/or insights.

/SAP-Analytics-Cloud-(1).webp?mode=resize&w=512&h=191&attachmenthistoryguid=ff0f1939-9746-41ba-a029-a3cff1e49e14&v=&c=e0f584bea731ed1dd0cbd38591267a8aceca4dda26418f44d7bbeb7ea232e38f)

/SAP-Analytics-1920x355-(1).webp?mode=autocrop&w=1000&h=750&attachmenthistoryguid=e35a79c7-96ba-4280-9d2a-a01d7df7af01&v=&focusX=1524&focusY=139&c=85c463436ee37acba140cff758613e8f17708716cd25bc2f98eaeaf6f57a6076)
/Website_Landingpage_DataScience_1920x355-(1).webp?mode=autocrop&w=1000&h=750&attachmenthistoryguid=552394b5-2cf5-46f8-8138-e9780e22b4cb&v=&c=6e7cae9d18dd5403383bd8c5fef364335b9972d8f63ddc35c41446b583ecca33)
